
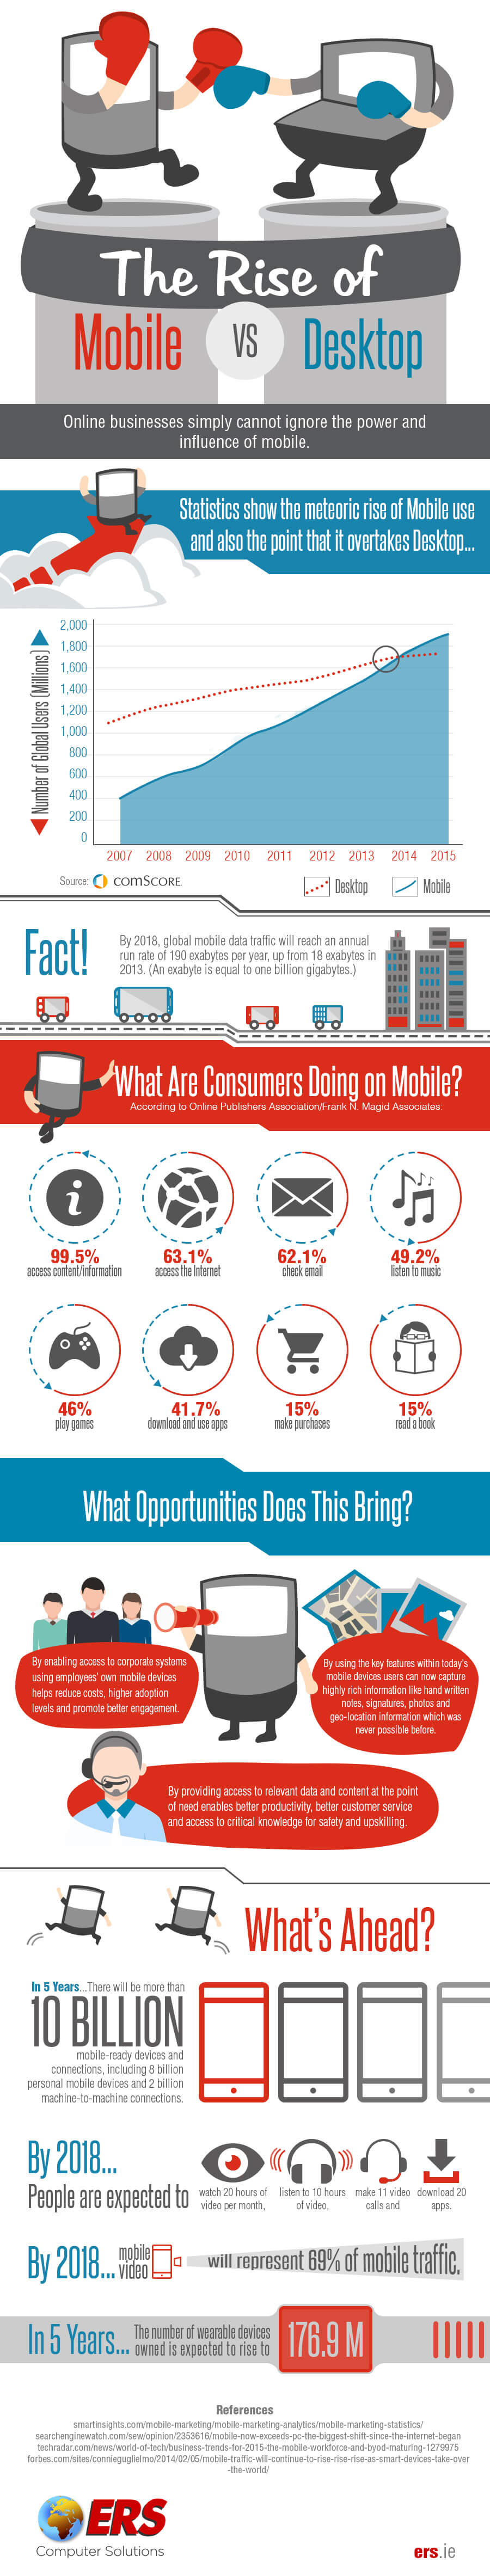
Online businesses simply cannot ignore the power and influence of mobile.
Statistics show the meteoric rise of Mobile use and also the point that it overtakes Desktop.
By 2018, global mobile data traffic will reach an annual run rate of 190 exabytes per year, up from 18 exabytes in 2013. (An Exabyte is equal to one billion gigabytes).
What are consumers doing on mobile?
- 5% access content/information. [bctt tweet=”5% of mobile consumers access content/information”]
- 1% access the Internet. [bctt tweet=”1% of mobile consumers access the Internet”]
- 1% check email. [bctt tweet=”1% of mobile consumers check email”]
- 2% listen to music. [bctt tweet=”2% of mobile consumers listen to music”]
- 46% play games. [bctt tweet=”46% of mobile consumers play games”]
- 7% download and use apps. [bctt tweet=”7% of mobile consumers download and use apps”]
- 15% make purchases. [bctt tweet=”15% of mobile consumers make purchases”]
- 15% read a book. [bctt tweet=”15% of mobile consumers read a book”]
What opportunities does this bring?
- By enabling access to corporate systems using employees’ own mobile devices helps reduce costs, higher adoption levels and promote better engagement.
- By using the key features within today’s mobile devices users can now capture highly rich information like hand written notes, signatures, photos and geo-location information which was never possible before.
- By providing access to relevant data and content at the point of need enables better productivity, better customer service and access to critical knowledge for safety and upskilling.
What’s ahead?
- In 5 years, there will be more than 10 billion mobile-ready devices and connections, including 8 billion personal mobile devices and 2 billion machine-to-machine connections. [bctt tweet=”In 5 years, there will be more than 10 billion mobile-ready devices and connections, including 8 billion personal mobile devices and 2 billion machine-to-machine connections”]
- By 2018, people are expected to watch 20 hours of video per month, listen to 10 hours of video, make 11 video calls and download 20 apps. [bctt tweet=”By 2018, people are expected to watch 20 hours of video per month, listen to 10 hours of video, make 11 video calls and download 20 apps”]
- By 2018, mobile video will represent 69% of mobile traffic. [bctt tweet=”By 2018, mobile video will represent 69% of mobile traffic”]
- In 5 years, the number of wearable devices owned is expected to rise to 176.9M. [bctt tweet=”In 5 years, the number of wearable devices owned is expected to rise to 176.9M”]
Infographic courtesy of ERS Computer Solutions.

One thought on “The Rise of Mobile vs. Desktop [Infographic]”